Before its introduction, every memory allocation had to be synchronised, which resulted in memory allocation being a major performance bottleneck. Memory arenas address this problem by introducing multiple memory pools, which are used to serve memory allocations by multiple threads concurrently.
This is a well written blog article about how memory arenas are implemented.
In contrast to the referenced article, this blog post focuses on how this concept can affect the observed memory behavior. This is especially interesting since it gets easily misinterpreted as a memory leak.
This article is based on a lightning talk which was presented at a meeting of the C++ user group in Munich. This article and the talk show how memory arenas can lead to a memory leak like behavior. For both, the following program is used:
https://github.com/celonis-se/memory-arena-example/blob/master/main.cpp
The program starts several workers in separate threads. There are two types of workers. The 30 MB worker and the 100 MB worker. The 30 MB worker allocates 30 MB of data and initializes it. The data is released after 100 milliseconds. It does that 10 times in a row. The 100MB worker does the same, but allocates 100 MB blocks. Which worker type and how many of them are started can be defined via a command line parameter.
After all workers are done with their work, the program waits for user input. It gives the user three options: the first one ends the program, the second executes malloc_trim(0), and the third prints the memory arena statistics by calling malloc_stats().
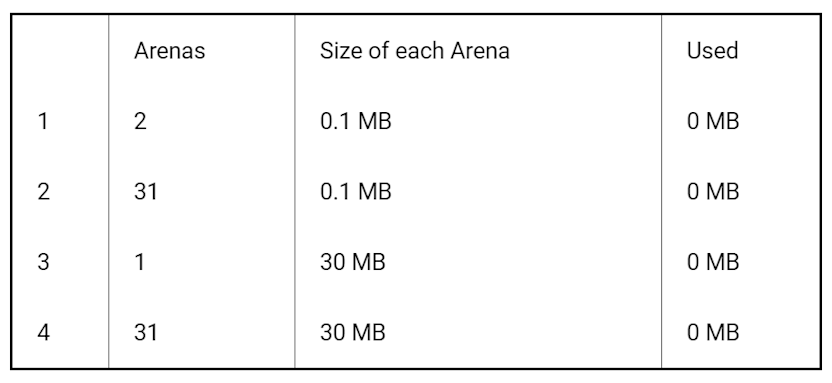
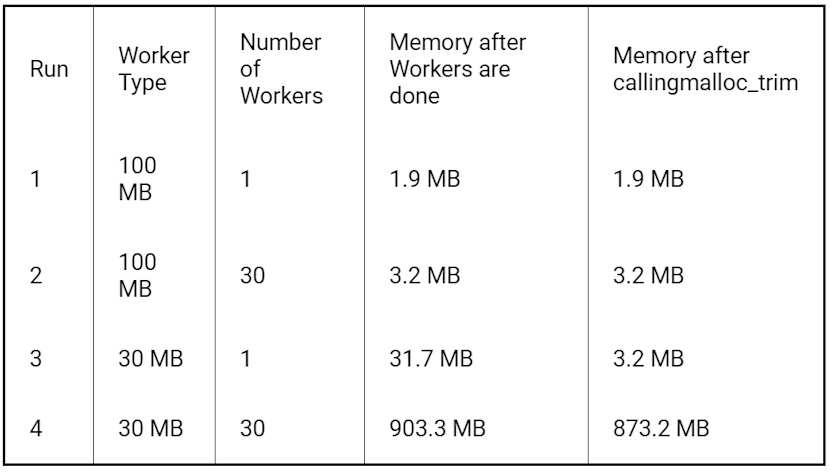
The following experiments were executed on a Ubuntu 16.04 with an 8 core (4 physical) CPU. The table below shows the resident memory of the process, for various worker types and worker numbers combinations, after all workers have finished their work and released all the data.
ubuntu_worker_types_and_worker_number_combinations.png
The 900 MB of residential memory after run number 4 is worth investigating. A natural conclusion would be a memory leak, which can be excluded by investigating the program with tools like Valgrind. The actual reason can be understood by taking a look at the arena statistics, which can be retrieved by calling malloc_stats().
For run 1, malloc_stats() generates for example the following output: